5 Queries
- Understand the types of queries and their uses.
- Create a simple select query using the wizard.
- Apply conditions in a query.
- Use grouping and perform calculations.
- Work with parameter queries, update queries, make-table queries, and crosstab queries.
Retrieving information from a database is one of the most common tasks for end users. Queries are essential for this. While end users can create simple queries, complex ones may require assistance from professionals.
5.1 About Creating Queries
The most common query type is the select query, which retrieves specific data from the database. Queries can also perform calculations (such as sums or averages) and come in varioustypes:
- Select query
-
Retrieves data from one or more tables and displays the results. It can also perform calculations (e.g., sum, average, count). This is the most widely used query type.
- Parameter query
-
Prompts the user to enter one or more values before running. For example, it can show all orders placed on a specific date.
- Update query
-
Modifies data in one or more fields for records that meet certain conditions, e.g., applying a 10% price increase to specific products.
Before creating a query, clearly define your information requirements.
5.2 Customers and Orders
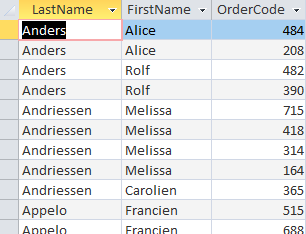
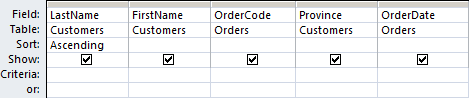
GOAL: Create a sorted list of all customers showing their last name, first name, and order codes.
ANALYSIS: Customer names are in the Customers table. Order codes are in the Orders table. The Query Wizard is suitable for this straightforward task.
Task 5.1 File: candy365.accdb
Open the database.
Go to tab Create > Query Wizard (group Queries). The New Query dialog box opens.
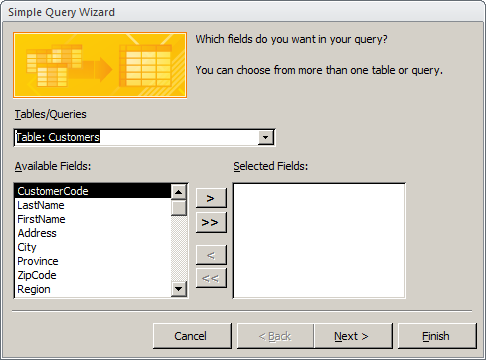
Select Simple Query Wizard, then click OK.
Under Tables/Queries, select Table: Customers.
Add fields LastName and FirstName.
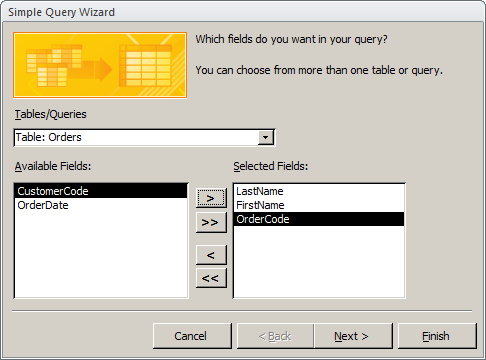
Switch to Table: Orders and add OrderCode.
Click Next, choose Detail (shows every field of every record), then click Next.
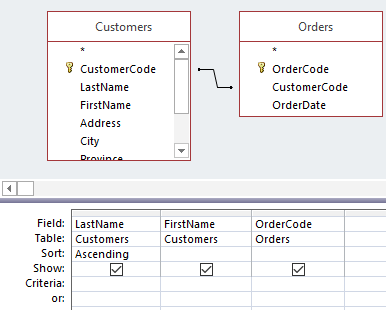
Name the query Customername+Ordercodes, select Modify the query design, and click Finish.
Sort the LastName field in Ascending order.
- Switch to Datasheet View to review the result.
- Close the query and save the changes.
5.3 Criteria in Queries
This section explains conditions in a query, the Like operator, and wildcards.
In a query, you can define conditions so that only records meeting these conditions are displayed. The Criteria row in the design grid is used for this purpose.
A criterion is similar to a formula. It is a string that can consist of field references, operators, and constants (values that remain the same). Query criteria are also called expressions. The formulation of a criterion depends on the data type of the field (text, numeric, date/time, yes/no).
| Category | Operators |
|---|---|
| Arithmetic | +, -, *, /, \, ^, Mod |
| Comparison | =, >, >=, <, <=, <> |
| Logical | And, Or, Not, Xor, Eqv |
| Concatenation | &, + |
| Special | Is Null, Is Not Null, Like, Between, In |
You can create simple or very complex criteria using these operators.
The Like operator plays a special role. It compares a value with a specific pattern. This pattern can be a literal string, such as Like “North”, or it can contain wildcards, such as Like “He*”. This makes the Like operator very powerful.
Date values must be enclosed in pound signs #. Some examples of date criteria: #12/5/2010#, >#9/1/2010#, >#9/1/2010# and <#9/15/2010#
Wildcards are placeholders for other characters, used when you don’t know the entire search pattern but only a part of it. The three most common wildcards are:
*: For any number of characters. Examples:"A*","*dam"?: For any single character. Example:"b?k"#: For any single digit. Example"1#5"
5.4 Orders from Utrecht Customers
This section covers manually adding fields and criteria to an existing query and saving the query under a new name.
To perform this task, you must have completed the steps in Section 5.2.
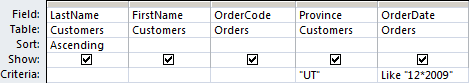
GOAL: Create a list sorted by last name, first name, and order codes for all customers who live in the province of Utrecht and placed an order in December 2009.
ANALYSIS: All required information is available in the query created in Section 5.2. However, two additional conditions (criteria) are needed:
- The Province field (in the Customers table) should have the value “UT”.
- The OrderDate field (in the Orders table) should have a value between December 1, 2009, and December 31, 2009.
Task 5.2 File: candy365.accdb
Open the database.
Open the CustomerName+OrderCodes query in Design View.
- Drag the Province field from the Customers table to the column next to OrderCode. Drag the OrderDate field from the Orders table to the next column.
Enter “UT” in the Criteria box under the Province field.
Enter
Like "12*2009"in the Criteria box under the OrderDate field.
For the date criteria you can use
Like "12*2009"if you only care about the month and the year. For more precise date ranges you should needBetween #12/1/2009# And #12/31/2009#.The asterisk * is a wildcard meaning any characters can be in its place. So, the string “12/*/2009” would match any day in December 2009.
Ensure your computer’s date format settings (e.g., American: month-day-year) are consistent with how you enter dates in Access criteria. Access typically interprets dates based on regional settings but using the unambiguous #mm/dd/yyyy# format is best practice.
Switch to Datasheet View and verify that all customers are from the province of Utrecht and that all order dates are in December 2009.
Switch to Design View and uncheck the Show box for the Province and OrderDate columns.
Switch to Datasheet View.
Save the query under a different name using File > Save Object As and specify the name UtrechtOrdersDec2009.
click OK and close the query.
5.5 Customers with Box CHER
This section describes creating a select query involving three tables.
GOAL: Towards the end of the calendar year, it’s noted that the sell-by date for CHER boxes is approaching. The sales department wants to organize a direct mail campaign for customers who have previously purchased CHER boxes. Create a list of all customers (last name, first name, and full address) who have bought at least one CHER box.
ANALYSIS: All customer information (first name, last name, address, zip code, city) is in the Customers table. The ordered boxes can be found in the BoxCode field in the OrderDetails table. To link an order to a customer, you also need the Orders table, which serves as the link between the Customers and OrderDetails tables. You’ll need to specify the value CHER for the BoxCode field as a condition.
When using the Wizard to create the query, it is sufficient to add only the necessary fields from the Customers and OrderDetails tables. The Wizard will then automatically add the Orders table because it links the Customers and OrderDetails tables. If you create the query manually from scratch, you must remember to add the Orders table yourself. Therefore, using the Wizard is preferred for this task.
It’s not necessary to include a criterion stating that at least one box was ordered, because this condition is automatically enforced by the joins between linked tables when retrieving related data.
Task 5.3 File: candy365.accdb
Open the database.
Choose Create tab > Query Wizard (Queries group). The New Query dialog box will be displayed, where you can select the query type.
Select Simple Query Wizard and click OK.
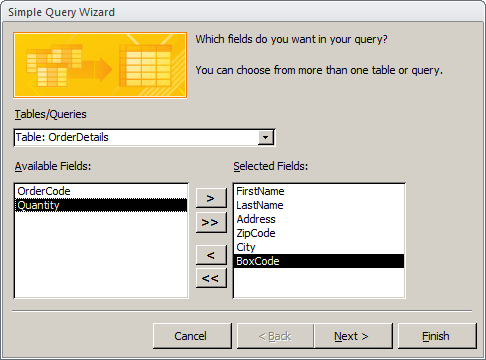
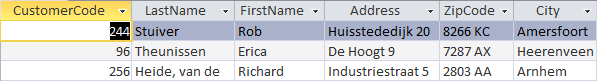
In the Tables/Queries list box, select Table: Customers. The fields of the Customers table will be displayed in the Available Fields box (see Figure 5.1).
Add the following fields: FirstName, LastName, Address, ZipCode, City. Select the field, and click
 .
.
You can also double click on a field to add or remove it.
In the Tables/Queries box, select Table: OrderDetails. The fields of the OrderDetails table will be displayed in the Available Fields box.
Add field BoxCode.
Click Next. Now you can specify if you want a detail or summary query.
Select Detail (shows every field of every record) and click Next.
Name the query CustomersAndCHER, select Modify the query design, and click Finish. The query will be saved and then appear in Design View.
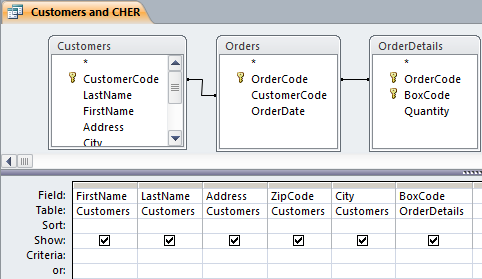
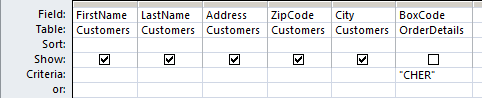
- Enter “CHER” in the Criteria row under the BoxCode column and uncheck the Show box for this field.
Switch to Datasheet View.
Close the query and save the changes.
5.6 Summarizing and Calculations
Simple select queries work with individual records. When you select certain customers from the Customers table with a query, you will see a record for each customer that meets the requirements. It is also possible to group your records and then perform calculations on these subgroups, similar to calculating totals and subtotals.
When a query is displayed in Design View, you will see the  on the ribbon under Query Design tab > Totals (Show/Hide group).
With this button, you can show or hide a Total row in the design grid. Access adds a Total box for each field, just below the table box.
For each added field, you can choose an option from the drop-down list in the Total row. This option determines whether the field is used in a calculation, for grouping, or for filtering. The available options can be divided into three categories:
- Grouping
-
The choice is Group By. The field is used to create smaller groups on which you can perform calculations. This is also the default option.
- Filtering
-
The choice is Where. The checkmark in the Show box is also cleared and should remain so. In the Criteria box, you can specify the value or expression for filtering.
- Calculations
-
The options are:
Sum,Avg,Min,Max,Count,StDev,Var,First,Last,Expression. The selected calculation is then performed for the field.
| Choice in Total box | Description |
|---|---|
Group By |
Groups records based on the values in this field. |
Sum |
Adds together the values in this field. |
Avg |
Averages the values in this field. |
Min |
Retains the smallest value in this field. |
Max |
Retains the largest value in this field. |
Count |
Counts the number of records (regardless of the field). |
StDev |
Calculates the standard deviation of values in this field. |
Var |
Calculates the variance of values in this field. |
First |
Retains the first value in this field for each group. |
Last |
Retains the last value in this field for each group. |
Expression |
Calculates a user-defined expression for this field. |
Where |
Filters records based on values in this field. |
Calculated Field
A calculated field takes data from one or more fields and performs arithmetic operations to produce new information. You can perform simple arithmetic, like addition and multiplication, or use Access’s built-in functions, such as Sum and Avg. You can only use fields that have been added to the query. To create a calculated field:
- Click in an empty column in the Field row of the design grid.
- Enter a name for the calculation (the result), followed by a colon (
:). - Enter the expression for the calculation.
You can use field names in the expression. Field names must be enclosed in square brackets ([]). If a field name contains no spaces, Access will add the square brackets for you after you enter the name. If a field name contains spaces, you must type the square brackets yourself.
When using one of the calculation options for summarizing, it is recommended to also provide a new name in front of the field name (e.g.,
AvgCost: PralineCosts); otherwise, Access generates a default name for the result in Datasheet View (e.g.,AvgOfPralineCosts). This new name must also be followed by a colon.
Here are some examples. Study them carefully. Create and experiment with them.
Example 5.1 Average Praline Costs per Chocolate Type
In this example, the ChocolateType field is used for grouping, creating a group for each chocolate type. The PralineCosts field is used to calculate the average praline costs for each group. The result is one record for each chocolate type, showing the average price.
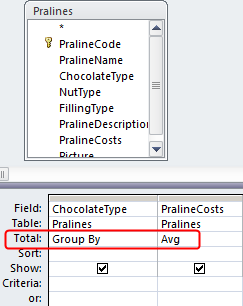
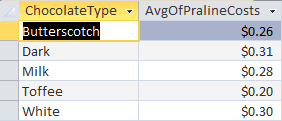
Because the column for the averages was not given a new custom name, Access generated the name AvgOfPralineCosts.
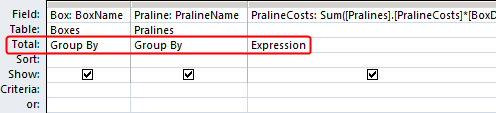
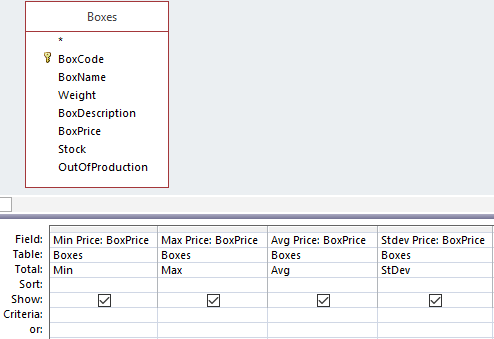
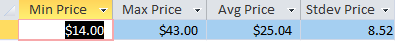
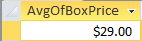
Example 5.2 Box Price Statistics
In this example, the BoxPrice field is used four times with different calculations. Each column was given a new name. The result of the query is a single record containing the four calculation results.
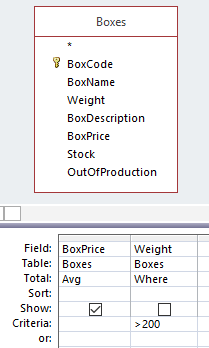
Example 5.3 Average Box Price for Boxes Over 200 Grams
Calculate the average price of boxes weighing more than 200 grams. The Weight field is used for filtering to include only boxes over 200 grams.
5.7 Customers per Province
Purpose: Using a select query with grouping and a calculation with the COUNT function.
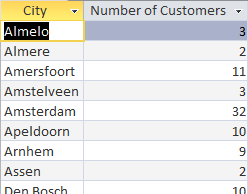
GOAL: Create a list showing the number of customers per province.
ANALYSIS: All necessary data is in the Customers table. You will need the Province field. A customer is uniquely identified by their CustomerCode, so you need to count the number of CustomerCodes in each province. This requires grouping by Province.
Task 5.4 File: candy365.accdb
Open the database.
Go to Create tab > Query Design (Queries group). Access creates a new blank query window and displays the Add Tables pane on the right side.
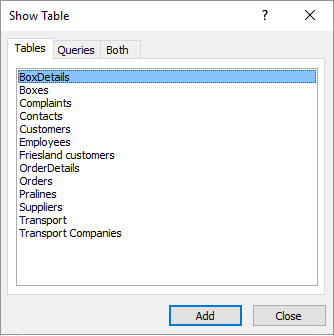
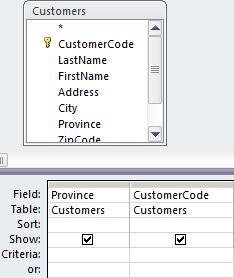
Select the Customers table, then click Add Selected Tables. The Customers table has now been added to the query window.
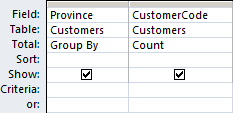
Successively add the Province and CustomerCode fields to the design grid by double-clicking each field.
- Click Query Design tab > Totals (Show/Hide group).
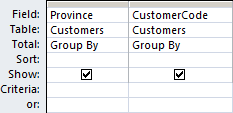
- In the Total row under the CustomerCode column, click and select
Countfrom the dropdown list.
- Switch to Datasheet View.
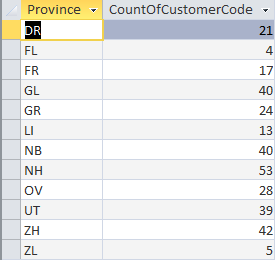
Close the query and answer Yes when prompted to save changes. The Save As dialog box will be displayed.
Name the query Number of customers per province and click OK.
5.8 Column Heading Modification
This section explains how to change column headings in a query.
To perform this task, you must have completed Section 5.7.
By default, Access uses field names as column headings in Datasheet View. For summarized data, Access generates a name (e.g., CountOfCustomerCode). It is recommended to use clearer, more descriptive names.
Task 5.5 File: candy365.accdb
Open the database.
Open the Number of customers per province query in Design View.
Place the cursor in the Field row for the CustomerCode field, at the beginning of the field name, and type”Total customers: “. (Ensure there’s a space after the colon if desired in the heading).
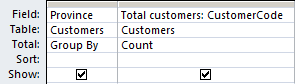
- Switch to Datasheet View.
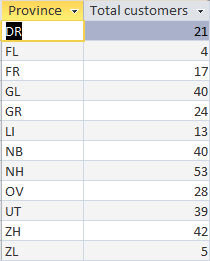
- Close the query and save the changes.
5.9 Calculate Order Amounts
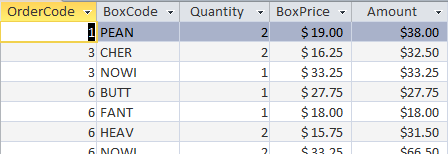
GOAL: Create a sorted list of order line items, showing for each order: order code, box code, number of boxes, box price, and the amount for each line item (i.e., for each type of box).
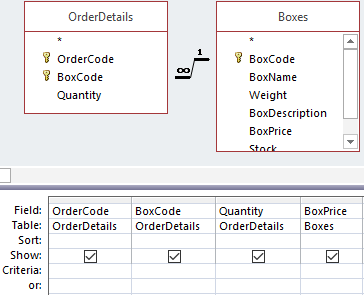
ANALYSIS: For each order, you can find the OrderCode, BoxCode, and the number of boxes (Quantity) in the OrderDetails table. The BoxPrice is in the Boxes table. The line item amount is not present in any table because this amount can be calculated from other data: Amount = Quantity * BoxPrice.
Task 5.6 File: candy365.accdb
Open the database.
Go to Create tab > Query Design (Queries group). Access creates a new blank query window and displays the Add Tables pane (see Figure 5.18 if necessary).
Add the OrderDetails and Boxes tables to the query window.
Add the fields OrderCode, BoxCode, Quantity (from the OrderDetails table), and BoxPrice (from the Boxes table) to the grid by double-clicking each field.
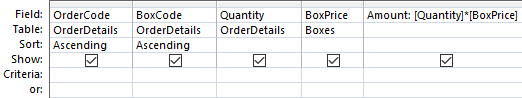
- Set the sort order for the OrderCode and BoxCode fields to Ascending. Click in the Field row of the first empty column and enter “Amount: Quantity*BoxPrice”. Access will automatically surround the field names with square brackets if they don’t contain spaces; otherwise, you must type them.
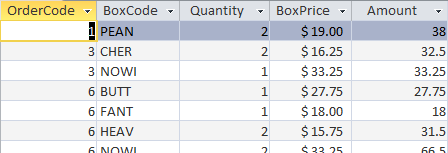
- Switch toDatasheet View.
- Switch to Design View.
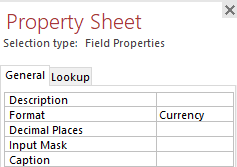
All objects in Access have properties. These properties determine, among other things, the appearance of the object. You can set properties in the Property Sheet. You can toggle the visibility of the Property Sheet with Query Design tab > Property Sheet (Show/Hide group). A faster way is to use the keyboard shortcut F4.
To format the amounts as currency, you need to change the Format property of the calculated Amount field.
- Ensure the Property Sheet is visible. Click anywhere in the Amount field in the design grid. In the Property Sheet, click in the Format box and choose Currency from the list box.
- Switch to Datasheet View.
Close the query and save the changes.
Name the query OrderRowAmount and click OK.
5.10 First Order per Customer
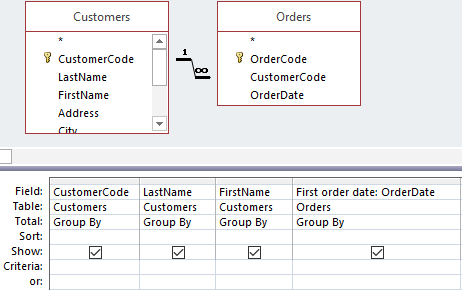
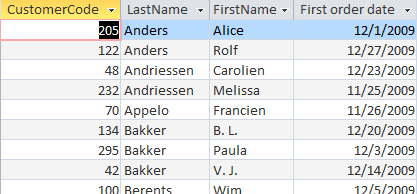
GOAL: Create a list of the first order for each customer. Show the customer code, customer name (last and first), and the date of their first order for every customer who has placed one or more orders.
ANALYSIS: The required data is in the Customers and Orders tables. You need to create a query showing customer data and order data. Finding the first order can be achieved by by using Min in the Total row for the OrderDate field, grouped by customer.
Task 5.7 File: candy365.accdb
Open the database.
Go to Create tab > Query Design (Queries group).
Add the Customers and Orders tables to the query window.
Add the fields CustomerCode, LastName, and FirstName (from Customers), and OrderDate (from Orders) to the grid by double-clicking each field.
Click Query Design tab > Totals (Show/Hide group).
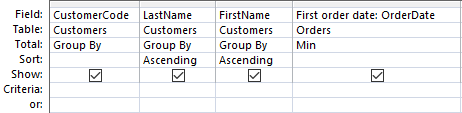
Change the column title for OrderDate by typing “First order date:”in front of the field name in the Field row.
In the Total row under the OrderDate (or FirstOrderDate: OrderDate) column, click and select
Minfrom the list. Ensure the Total row for CustomerCode, LastName, and FirstName is set toGroup By.Set the sort order for LastName and FirstName to Ascending.
- Switch to Datasheet View.
Close the query and save the changes.
Name the query First order dates and click OK.
5.11 Parameter Query
A parameter query displays a dialog box that prompts the user for additional information when it runs, such as criteria for retrieving records or a value to insert into a field. You can design the query to request multiple pieces of data, for example, a start and end date, to retrieve all records with dates between them.
Parameter queries are also useful as a basis for forms and reports. For example, based on a parameter query, you can create a monthly revenue report. When printing the report, a dialog box will prompt you for the month you want to print; you enter the month, and the correct report will be printed.
GOAL: At Snoopy, customer service representatives regularly receive phone inquiries about specific orders. You want to be able to quickly retrieve and display the data for a particular order. This can be achieved with a parameter query that asks for the order code when the query is run.
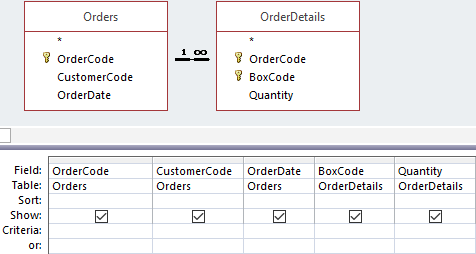
ANALYSIS: The necessary information about a particular order is in the Orders and OrderDetails tables. Prompting for the order code can be controlled via a criterion.
Task 5.8 File: candy365.accdb
Open the database.
Go to Create tab > Query Design (Queries group).
Add the Orders and OrderDetails tables to the query window.
Add the fields OrderCode, CustomerCode, OrderDate (from Orders), and BoxCode and Quantity (from OrderDetails) to the grid by double-clicking each field.
- In the Criteria row under the OrderCode column, type
[Enter order code]. The square brackets indicate to Access that this is a parameter.
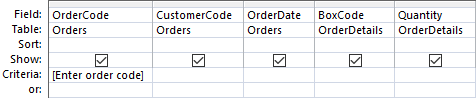
Switch to Datasheet View. The Enter Parameter Value dialog box will appear, prompting you to enter the order code.
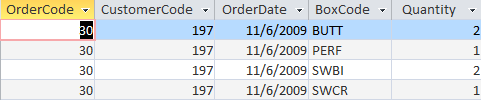
Enter a value, e.g. 30, and click OK.
Close the query and save the changes.
Name the query Information specific order and click OK.
5.12 Action Queries
Most queries are select queries, used to search, collect, and display data, but not to change it. However, Access also has another category of queries, known as action queries, with which you can change data by deleting, updating, or adding records. The main advantage of an action query is that it can change a large number of records without requiring programming knowledge. The way you create and work with these queries is similar: first, create a select query, and then change the query type.
Access has four types of action queries:
- Make Table
-
Selects one or more records and then creates a new table for them. This new table can be placed in the current database or created as a new table in a different database. You can use a Make Table query, for example, to copy outdated data to an archive database.
- Append
-
Selects one or more records and then adds them to another existing table. For example, suppose you acquire new customers whose information has been stored in a separate table. With an append query, you can move these records to your main customers table.
- Delete
-
Deletes one or more records. You specify a set of filter conditions, and then Access deletes the matching records. For example, you can remove products that are discontinued.
- Update
-
Changes values in one or more records. Existing values in a field are replaced by new values, similar to a search and replace operation. You cannot undo the changes made by an update query, so it is advisable to first back up the database or the specific table before running the update query.
Because these queries change data in the database, these queries could be a security risk. To provide protection, a number of checks are carried out in Access and the Trust Center. The trust center can disable the content. When opening such a database, Access displays a message with a security warning.

If you want to enable the content, click Enable Content > Options and choose the desired option in the dialog box that appears. The database is opened again with full functionality.
It is also advisable to make a backup of the tables that are changed. That ’s easy to do with copy and paste.
Example 5.4 Creating a Copy of a Table
- In the Navigation Pane, right-click the name of the table and select Copy from the shortcut menu.
- Right-click again in a blank area of the Navigation Pane and choose Paste. Give the new table a different name when prompted (e.g., TableName_Backup).
To recover a table after an unintended change using a backup copy:
- Delete or rename the changed table. For instance, in the Navigation Pane, right-click the name of the changed table and select Delete or Rename.
- Right-click the backup copy of the table and choose Rename. Give the table its original name.
5.12.1 Update Query
This section provides an example of a simple update query that changes values in a field for all records satisfying a certain condition.
GOAL: The costs of all pralines with chocolate type “White” should be increased by 10%.
ANALYSIS: All necessary data is in the Pralines table. You need the ChocolateType and PralineCosts fields. Selecting the white chocolate types can be done by adding a criterion to the query. You can increase the PralineCosts by 10% by multiplying the current value by 1.1.
Make a backup (copy) of the table, so you can restore the original situation. Another possibility is to backup (copy) the whole database.
Task 5.9 File: candy365.accdb
Open the database.
Go to Create tab > Query Design (Queries group).
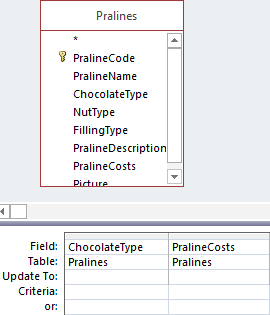
Add the Pralines table to the query window.
Add the ChocolateType and PralineCosts fields to the grid by double-clicking each field.
Change the query type by clicking Update in the Query Type group on the Query Design tab. The Sort and Show rows will disappear, and a new row, Update To, will appear.
In the Criteria box under the ChocolateType column, enter “White”.
In the Update To box under the PralineCosts column, type “[PralineCosts]*1.1”.
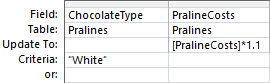
- Access will surround text criteria like “White” with double quotes if you don’t type them.
- Field names in expressions must be enclosed in square brackets ([]).
Save the query by clicking the Save button () on the Quick Access Toolbar and name it “Increase costs white chocolates with 10%”.
Click Run in the Results group on the Query Design tab. A dialog box will appear asking for confirmation and stating how many rows will be updated.
Click Yes to proceed with the update.
Close the query.
5.12.2 Make Table Query
Purpose: Creating a new table using a Make-Table query.
GOAL: The marketing department has a special offer for all customers in Friesland. For this, they need a table containing only the customer data for customers in the province of Friesland.
ANALYSIS: All necessary data is in the Customers table. Selecting customers from Friesland can be done with a criterion in the query. First, you need to create this select query and then change its type to Make Table.
Task 5.10 File: candy365.accdb
Create select query
Open the database.
Go to Create tab > Query Design (Queries group).
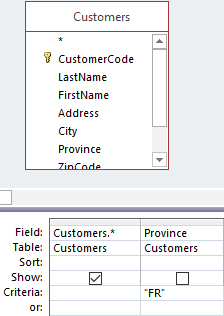
Add the Customers table to the query window.
Add all fields by double-clicking the asterisk (*) at the top of the Customers field list in the table object. Then, separately add the Province field again (this allows you to set criteria on it without affecting the display of all other fields from the asterisk).
Enter “FR” as the criterion for the separately added Province field and uncheck its Show box (because this field’s data will already be shown via the Customers.* selection).
Check the output of the query by switching to Datasheet View.
Save the query with the name Customers Friesland.
Change the query type
Open the Customers Friesland query in Design View.
Click Make Table in the Query Type group on the Query Design tab. The Make Table dialog box will open.
Name the new table Friesland customers and ensure the option Current Database is selected for where the table should be created.
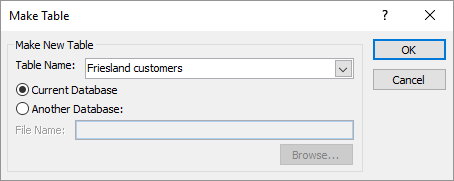
click OK.
Click Run in the Results group on the Query Design tab. A dialog box will appear asking for confirmation and stating how many rows will be copied.
click Yes. The new table will be created.
Close the query. A dialog box will ask whether the changes to the query design (i.e., changing its type to a make-table query) should be saved.
click Yes.
This prompt appears because the query type has been changed. This change is also reflected by the query’s icon in the Navigation Pane under Queries.
The query icon in front of the query name, ![]() , indicates it’s an action query:
, indicates it’s an action query:
5.13 Crosstab Query
A crosstab query calculates a sum, average, or other aggregate function, and then groups the results by two sets of values: one down the left side of the datasheet (row headings) and another across the top (column headings). A crosstab query is similar in structure to an Excel PivotTable report and is often easier to read than a regular select query displaying the same data because the overview is more compact due to its horizontal and vertical alignment.
When you create a crosstab query, you specify which fields contain row headings, which field contains column headings, and which field contains values to summarize. You can use multiple fields for row headings (up to three), but only one field for column headings and one field for the values to summarize. It’s also possible to use an expression for the row heading(s), column heading(s), and the values to summarize.
The easiest and fastest way to create a crosstab query is by using the Crosstab Query Wizard. For more complex queries, you can often start with this Wizard and then fine-tune the query in Design View.
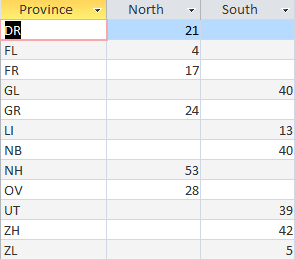
GOAL: Calculate the number of customers by province and by region, and show the result in a crosstab table.
ANALYSIS: All necessary data can be found in the Customers table.
Task 5.11 File: candy365.accdb
Open the database.
Choose Create tab > Query Wizard (Queries group). Select Crosstab Query Wizard and click OK. In the screen that appears, select the table or query that contains the fields for the crosstab.
Select Table: Customers and click Next. Now, select the field(s) for the row headings.
Select the Province field and move it to the Selected Fields list to be used as a row heading.
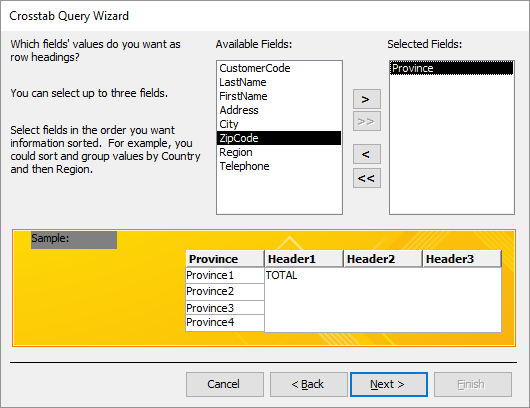
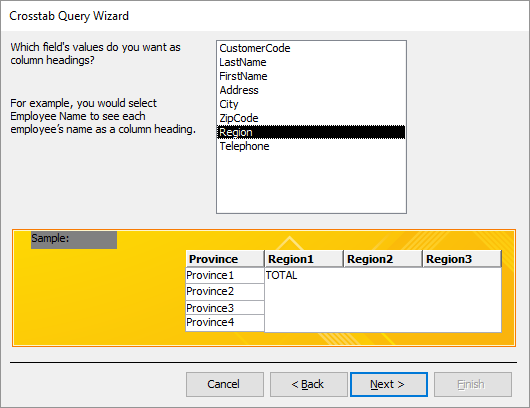
click Next. Now, select the field for the column headings.
Select the Region field.
Click Next. Now, select the field whose values you want to aggregate and the aggregate function.
For the field to calculate, select CustomerCode. For the function, select
Count. Deselect the option Yes, include row sums if you don’t want totals for each province.
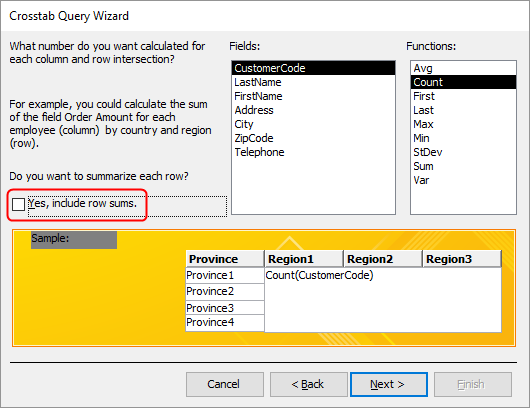
click Next.
Name the query Number of customers by province by region. Select View the query, and click Finish.
5.14 Exercises
Exercise 5.1 Customers from Friesland and Groningen (quer001)
Create a query to select customers in the provinces of Friesland (FR) and Groningen (GR). Show LastName, FirstName, and City. Name the query quer001.
The Province field can have two values here: FR or GR. You can achieve this by entering one value in the Criteria row and the other value in the or row below it. Alternatively, use an expression with the Or operator in the Criteria row, like “FR” Or “GR”.
Result: 40 customers
Exercise 5.2 Direct Mail Campaign for MARZ Box (quer002)
Suppose it is the end of December 2010. The expiration date of the MARZ box is approaching, and there is still plenty in stock. You want to start a direct mail campaign targeting customers who ordered at least one MARZ box between August and November 2010 (inclusive). Show the name and address of these customers. Name the query quer002.
Result: 4 customers
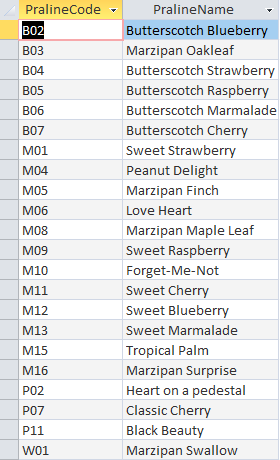
Exercise 5.3 Praline Boxes with Low Price (quer003)
Create a list of boxes whose price is $17.50 or less. Show the fields BoxCode, BoxName, and BoxPrice. Name the query quer003.
Result: 4 boxes
Exercise 5.4 Milk and Dark Pralines with Low Cost (quer004)
Create a list of pralines with chocolate type “Milk” or “Dark” (Pure) and whose costs are 30 cents or less. Show the fields PralineCode, PralineName, ChocolateType, and PralineCosts. Name the query quer004.
Result: 18 pralines
Exercise 5.5 Customers from Enschede, Hengelo or Almelo (quer005)
Create a list of all customers (name and address) who live in Enschede, Hengelo, or Almelo. Name the query quer005.
Result: 12 customers
Exercise 5.6 Customers from Amsterdam with Zip Code 20* (quer006)
Create a list of customers from Amsterdam (name and address) whose zip code begins with 20. Name the query quer006.
Result: 3 customers
Exercise 5.7 Pralines Without Filling (quer007)
Create a list of all pralines without filling. Name the query quer007.
First, determine what value the FillingType field (or equivalent) has for pralines without filling (e.g., it might be Null or an empty string).
Result: 12 pralines.
Exercise 5.8 Customers Outside Amsterdam (quer008)
Create a list of all customers who do not live in Amsterdam. Name the query quer008.
Find out which operator to use for “not equal to” (usually <>).
Result: 293 customers
Exercise 5.9 Number of Pralines per Box (quer009)
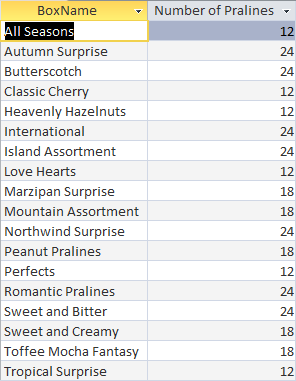
Create a list of all box names with their total number of individual pralines per box. The column showing the number of pralines should have an appropriate title. The list should be sorted in ascending order by box name. Name the query quer009. (Hint: This usually involves summing the Quantity field from BoxDetails for each box).
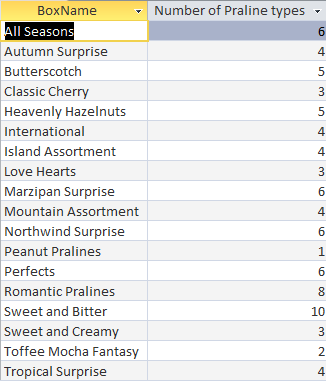
Exercise 5.10 Number of praline types per box (quer010)
Create a list of box names and their number of praline types per box. The column showing the number of pralines should have an appropriate title. The list should be sorted in ascending order of box name. Name the query quer010.
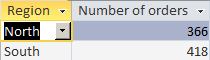
Exercise 5.11 Number of Orders per Region(quer011)
Create a list showing the number of orders per region. The column with the numbers should have an appropriate title. Name the query quer011.
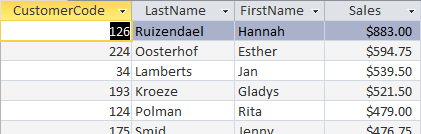
Exercise 5.12 Total Sales per Customer (quer012)
Create a list with the total sales amount per customer. Show customer code, customer name, and the total sales. The sales column should have an appropriate title and currency formatting. Sort by sales in descending order. Name the query quer012.
Exercise 5.13 Customers with Orders (quer013)
Create a list of customers (code and name) who have placed at least one order. Name the query quer013.
Result: 264 customers
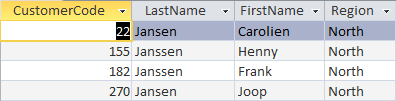
Exercise 5.14 Customers with Last Name Jansen or Janssen in North Region (quer014)
Create a list of customers with the last name Jansen or Janssen who are in the “North” region. Show relevant details. Name the query quer014.
Exercise 5.15 Pralines with Filling and Without Nuts (quer015)
Create a list of pralines that have a filling but do not contain nuts. Show relevant praline details. Name the query quer015.
Result: 22 pralines
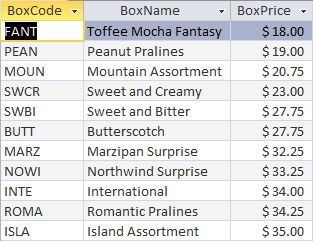
Exercise 5.16 Boxes Heavier than 150 Grams with Max Price $35 (quer016)
Create a list of boxes that are heavier than 150 grams and have a maximum price of $35. Show only BoxCode, BoxName, and BoxPrice. Sort the boxes by price in ascending order. Name the query quer016.
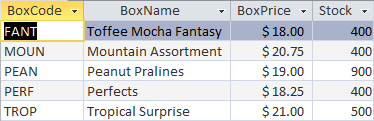
Exercise 5.17 Boxes Priced $17-$25 with Stock of at least 400 (quer017)
Create a list of boxes with a price between $17 and $25 (inclusive) and of which there are at least 400 in stock. Show the code, name, price, and stock of these boxes. Name the query quer017.
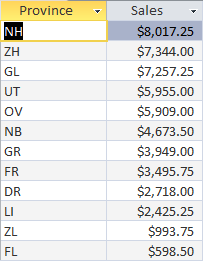
Exercise 5.18 Total Sales per Province (quer018)
Create a list of total sales per province. The sales column should have an appropriate title and currency formatting. Sort by sales in descending order. Name the query quer018.
Exercise 5.19 Customers with Orders the Week Before Christmas (quer019)
Create a list of customers who placed an order in the last week before Christmas 2010 (December 20, 2010, through December 24, 2010). Show the code, name, and address of these customers. Each customer should appear only once in the overview, even if they placed multiple orders during this period. Name the query quer019.
The same customer might appear on the list multiple times if they made several orders. To avoid this, set the query property “Unique Values” to “Yes” in the query’s Property Sheet.
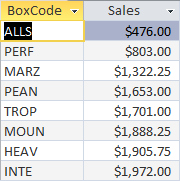
Exercise 5.20 Boxes with Low Sales (quer020)
Create a list of boxes with low sales, defined as less than $2000 in total sales. Show the box code and its total sales. Sort by sales in ascending order. The sales column should have an appropriate title and currency formatting. Name the query quer020.
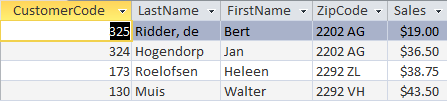
Exercise 5.21 Customers with Zip Code Starting 22 and Total Sales less than $50 (quer021)
Create a list of customers whose zip code starts with 22 and who have total sales of $50 or less. Show relevant customer and sales information. Name the query quer021.
Exercise 5.22 Customers for “Sweet and Bitter” Box in 2009 (quer023)
Create an alphabetical list of customers who bought at least one “Sweet and Bitter” box in 2009. Ensure there are no duplicate customer records in the result. Name the query quer023.
The same customer might appear on the list multiple times if they made several orders. To avoid this, set the query property “Unique Values” to “Yes.”
Result: 96 customers
Exercise 5.23 Cities with at Least 2 Customers (quer024)
Create an alphabetical list of cities that have at least 2 customers. Name the query quer024.
Exercise 5.24 Parameter Query for Praline Chocolate Type (quer025)
There are several chocolate types for pralines: Butterscotch, Milk, Dark, Toffee, and White. Create a parameter query that prompts the user to enter a chocolate type when the query runs, and then displays the pralines of that type. Show ChocolateType, PralineName, PralineCosts, and PralineDescription. Name the query quer025.
Exercise 5.25 Update Query for Price Reduction (quer026)
Due to a decline in the world market price of chocolate, the prices of all boxes can be reduced by 15%.
- Start by making a backup copy of the entire database or at least the Boxes table.
- Design an update query to implement this reduction. Name the query quer026 and run it.
- After verifying the result, you would typically keep this change. For exercise purposes, restore the original situation from your backup.
- Making a backup is crucial because you cannot easily undo the execution of an update query.
- Be aware that every time you run this query, the prices will be reduced by an additional 15% from their current values.
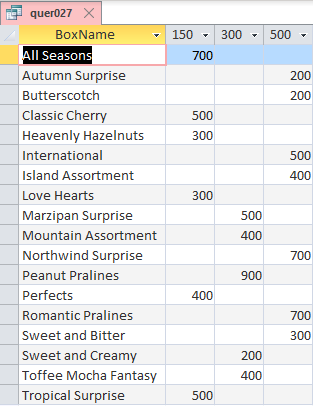
Exercise 5.26 Crosstab Boxes per Weight (quer027)
Create a crosstab query with box names as row headings, the weight of the boxes as column headings, and the stock quantity as the summarized value in the table. Name the query quer027.
Exercise 5.27 pdate Query for Price Increase (quer028)
Due to an increase in the chocolate price on the world market, the prices of all boxes must be increased by 10%.
- Start by making a backup copy of the table or the entire database.
- Design an update query to implement this price increase. Name the query quer028 and execute it.
- For exercise purposes, restore the original situation from your backup.
- Making a backup is important because you cannot revert the execution of an update query.
- Be aware that each time you execute this query, the prices will be further increased by 10%.
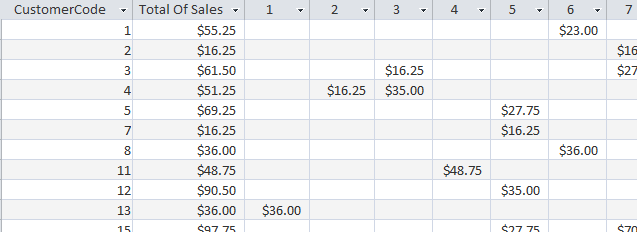
Exercise 5.28 Crosstab Sales per Customer per Month (quer029)
Create a crosstab query to provide an overview of total sales per customer per month in 2010. To do this, first create a select query named SalesPerCustomerPerMonth2010 that calculates these monthly sales. Then, use this select query as the source for the crosstab query. Display customers using their customer number and months using month numbers (e.g., 1 for January, 2 for February). Also, display the total sales for each customer in 2010 (row sums). Name the crosstab query quer029.