7 Reports
- What reports are used for.
- How to create labels using the Wizard.
- Creating an auto-generated report with manual adjustments
- Creating a grouped report.
- Creating a label report with chocolate images
Reports are structured summaries typically intended for printing. Labels are also a form of report.
7.1 Creating Reports
Reports are used to present summaries or overviews of large data sets, especially when preparing them for printing.
For example, to clearly print a sales summary on paper, you would use a report. Reports can include subtotals and grand totals. You can build reports manually, but using the Wizard is much more efficient.
Reports can also be dynamic through the use of parameters. When opening a report, you may be prompted to enter criteria. For example, the Sales per box report asks for a start and end date when opened.
7.2 Creating Labels
This section explains how to create address labels using the Label Wizard.
Task 7.1 File: candy365.accdb
Open the database.
Select the Customers table.
Go to Create > Labels (group Reports).
Choose
Metricunits, manufacturerAvery, and productAvery L7160, see Figure 7.1.
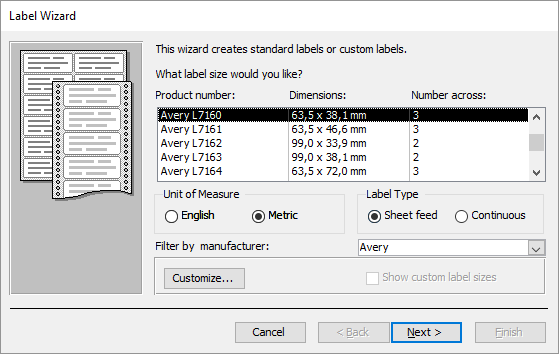
Click Next. On the next screen, you can customize the font and color of the label text.
Accept the default settings and click Next.
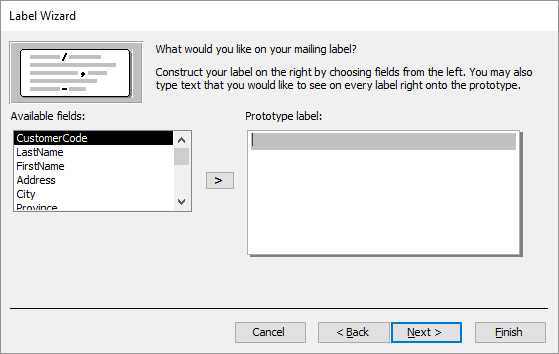
You can insert fields by double-clicking the field name or using the > button. The field name appears in curly braces on the sample label. You can type regular text and use Enter to create line breaks.
- Create the following sample label (with one space between first and last name, and two spaces between zip code and city):
{FirstName} {LastName}
{Address}
{ZipCode} {City}
Click Next. Choose to sort the labels by ZipCode.
Click Next. On the final screen, give the report the name Labels Customers and click Finish.
- Close the report.
7.3 Auto-Generated Report
Access can generate a basic report from a table or query. While the result is functional, it often needs manual refinement.
Task 7.2 File: candy365.accdb
Open the database.
Select the Sales per region per box query.
Go to Create > Report (Reports group). The report is generated and opens in Layout View.
You’ll notice that the Region field is repeated for each record and that the sales amounts are not formatted as currency. We’ll fix this.
Close the report and confirm saving when prompted.
Name the report Sales per region per box and click OK.
Reopen the report in Design View.
Select the Region field in the Detail section. In the Property Sheet, set Hide Duplicates to
Yes.
The Property Sheet can be made visible and invisible by clicking on button Property Sheet or by using hotkey F4.
Select the Sales field and set its Format to
Currency.Switch to Report View. Now the Region is shown only once per group and the sales values are formatted properly.
Save and close the report.
7.4 Grouped Report
GOAL
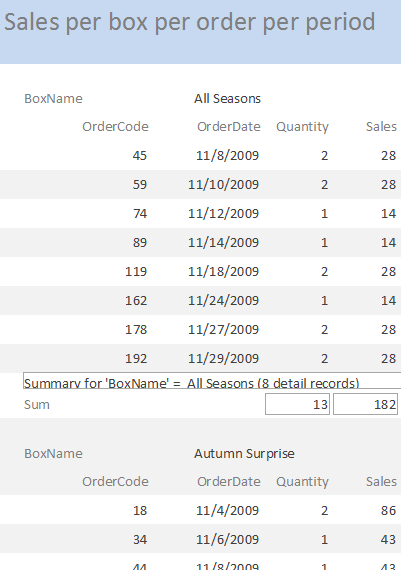
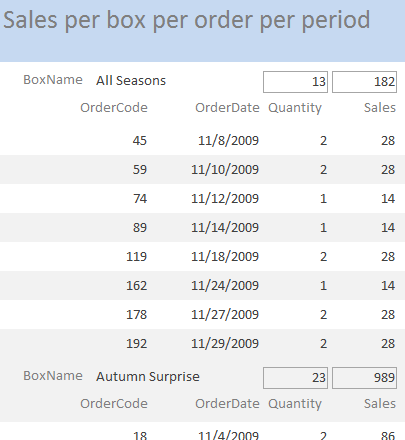
Create a report that shows, for a specified period, the sales per box, including order details. For example, see Figure 7.4, which shows a portion of the report for November 2009.
ANALYSIS
The report needs the following fields:
- BoxName
- OrderCode
- OrderDate
- Quantity
- Sales, calculated as
[Quantity] * [BoxPrice]
A query named Sales per box per order per period already exists and includes all these fields.
Task 7.3 File: candy365.accdb
Open the database.
Select the query Sales per box per order per period.
Go to tab Create > Report Wizard (Reports group).
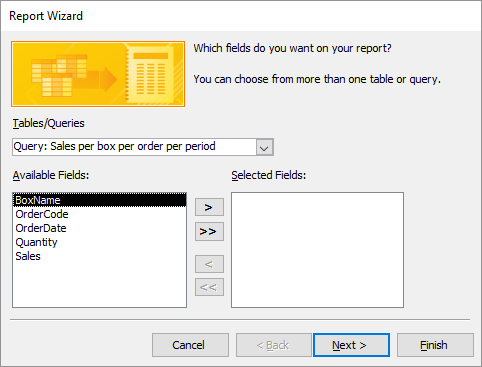
Add all fields from the query, then click Next.
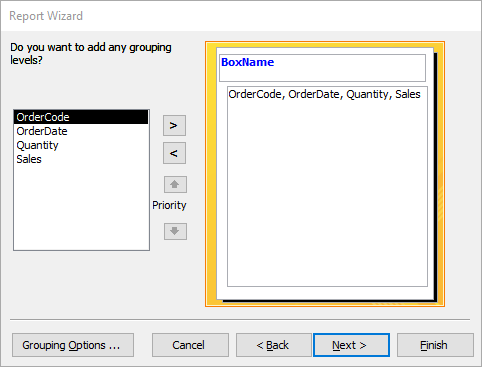
Remove the default grouping (OrderCode) and add BoxName as the grouping level.
- Click Next. Set sorting to ascending by OrderCode.
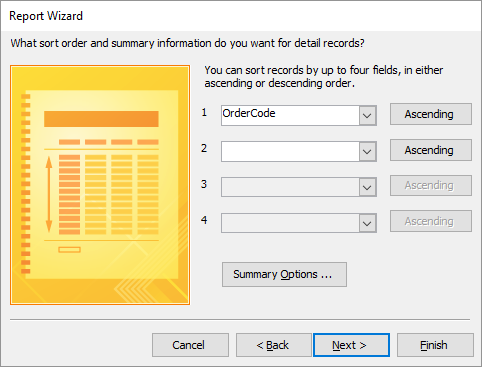
- Click Summary Options…. Enable summing for both Quantity and Sales.
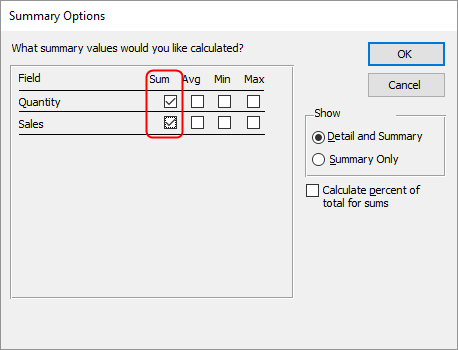
Click OK, then Next.
Choose the Outline layout.
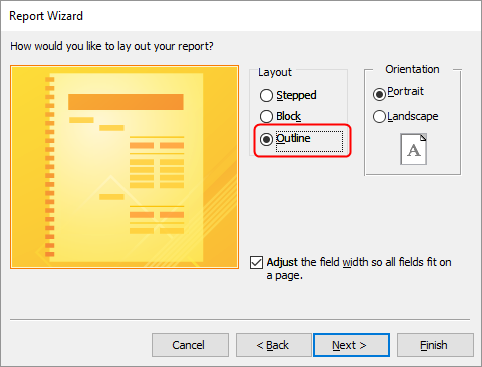
Click Next. Enter the report name: Sales per box per order per period, then click Finish.
When prompted, enter the start and end dates. For example:
- Start Date:
11/1/2009 - End Date:
11/30/2009
- Start Date:
Close the report after verifying the output.
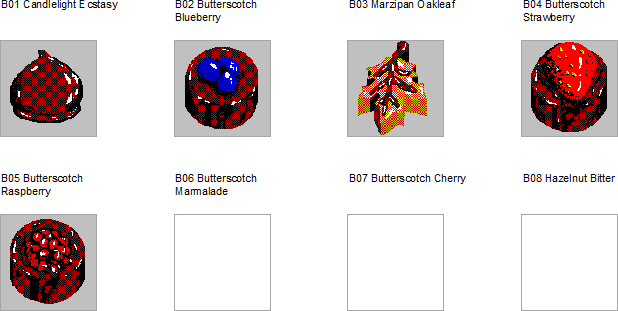
7.5 Praline Pictures
In this task, you’ll create a report that includes images of pralines, with the praline code and name displayed above each image. This will be done using labels, with one praline per label.
Task 7.4 File: candy365.accdb
Open the database.
Select the Pralines table.
Go to tab Create > Labels (Reports group).
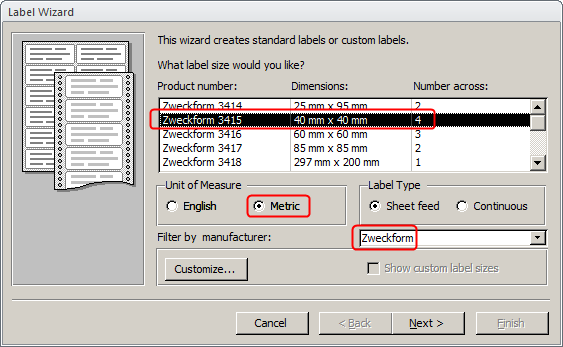
Choose
Metricas the unit, manufacturerZweckform, and productZweckform 3415.
Click Next. On the next screen, you can change the font and text color.
Accept the default settings and click Next.
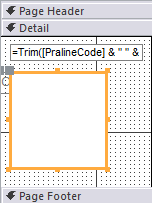
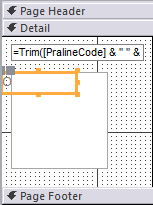
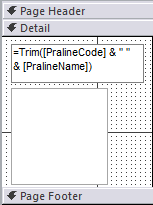
Create the following prototype label ( with one space between the fields):
{PralineCode} {PralineName}Click Next and sort the labels by PralineCode.
Click Next. Name the report Labels Pralines and click Finish.
The report is generated and displayed in Print Preview. Switch to Design View.
Click Design > Bound Object Frame (group Controls),
 , and draw a square about 1 inch by 1 inch in the Detail section.
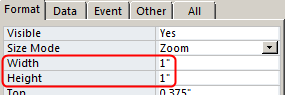
With the frame selected, adjust the following properties in the Property Sheet:
- In the Format tab, set Width and Height to
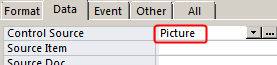
1"(Access may slightly adjust the dimensions). - In the Data tab, set the Control Source to the field
Picture.
- In the Format tab, set Width and Height to
- Select the label that is located behind the image frame.
Delete the label using the Delete key.
Switch to Print Preview.
The images are now displayed, but their vertical alignment may vary. To ensure consistency, the text fields should have a fixed height so all images align evenly.
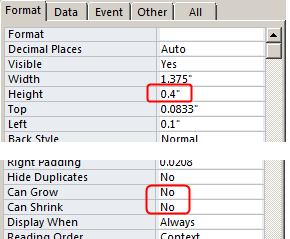
- Return to Design View, select the text box, and set the following properties:
- Height:
0.4" - Can Grow:
No - Can Shrink:
No
- Height:
- Align the text box and the image frame to the left.
- Switch back to Print Preview to verify the layout.
- Save and close the report.
7.6 Exercises
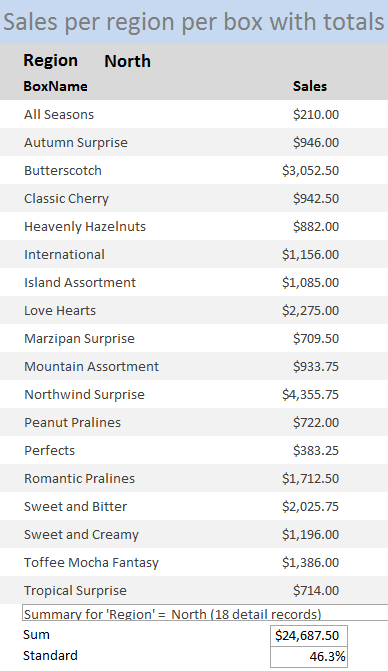
Exercise 7.1 Sales per Region per Box (rapp001)
Create a report showing sales per region per box. The report should also include the total sales for each region and show the percentage of total sales across all regions. Name the report rapp001.
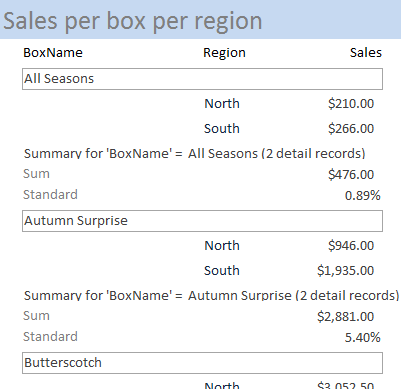
Exercise 7.2 Sales per Box per Region (rapp002)
Create a report that shows, for each box, the sales figures per region. Name the report rapp002.
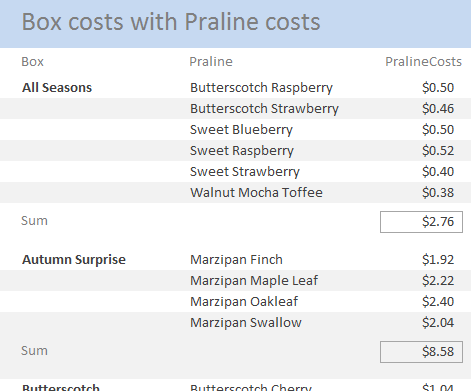
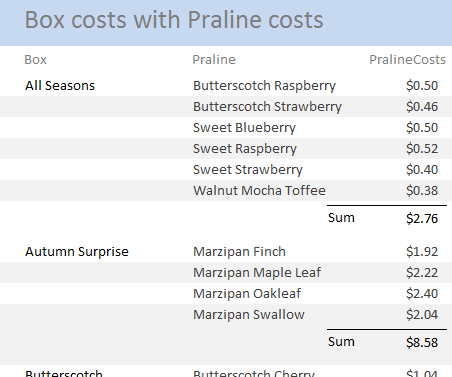
Exercise 7.3 Box and Praline Costs (rapp003)
Create a report that lists all pralines in each box, including the cost of each praline. Also, include the total praline cost per box. Name the report rapp003.
Exercise 7.4 Box and Praline Costs Grouped (rapp004)
Create a copy of the rapp003 report and name the copy rapp004. Modify the report so that each box starts on a new page. To do this, set the Force New Page property of the group header to Before Section.
Also adjust the layout slightly: move the Sum text box to the right and draw a small horizontal line above the sum.
Each box forms a group, so the group header is called “Box Header”.
Exercise 7.5 Sales per Box per Order per Period (rapp005)
Create a copy of the Sales per box per order per period report and name it rapp005. Modify the layout so that the total sales per box are printed next to the box name.
Exercise 7.6 Box Data on Separate Pages (rapp006)
Create a copy of the rapp005 report and name it rapp006. Modify the design so that each box starts on a new page.
Set the Force New Page property of the BoxName group header to Before Section.
Exercise 7.7 Box Labels (rapp007)
Create a label report for all boxes following the example below. Use Avery J8163 labels (1½” x 3 9/10”), font: Consolas, size: 12 pt, black. Name the report rapp007.
All Seasons
Code : ALLS
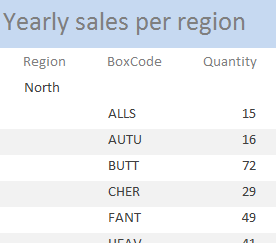
Weight: 150 gramExercise 7.8 Yearly Sales per Region (rapp008)
Create a report based on a parameter query with grouping.
The report should show the number of boxes sold per region for a user-specified year. When opening the report, the user should be prompted to enter the year. Name the report rapp008.
First, create a parameter query named Yearly sales per region that retrieves the required data and prompts for the year.